I address the criticism.
Wow! Well that was unexpected! My little 2 minute video parody of Skeptical Science's "step-wise graph" went viral.
Wow! Well that was unexpected! My little 2 minute video parody of Skeptical Science's "step-wise graph" went viral.
I only advertised it once with a single tweet:

I only had
14 twitter followers at the time, yet somehow it went "viral" as they
say. Nothing like this has ever happened to me before; it's weird and exiting
all at the same time! I have a similar 6 min parody video in the works. I guess
I'll have to make it a top priority with this reaction!

From what I
can tell, a cartoonist called Josh, who would be familiar to WUWT readers like
me, picked up on it and sent it to Anthony. So there I am reading my favourite climate
website WattsUpWithThat and I'm gobsmacked to see my own video on it.

I didn't
mind at all that some people thought it
was the work of Josh, I was just amazed to see it there! In fact I quipped in
the comments all the better if they think it's Josh's! He's a good cartoonist
after all.

I've also
come in for some criticism over it, something which was also unexpected by me. The mods at WUWT tried to shield the video
from such criticism snipping some critical comments and saying the video is
just a satire. It is a satire but it's also meant to be 100% factual. If I've
made a mistake I'd be upset, and I welcome the criticism. So far
though I can't see anything that negates the validity of the video.
One
criticism is that the temp scale on the left of the Greenland ice core data is
centred around -33C. True, but more important is the relative temp change and the magnitude of
that difference. We use polar ice sheet data because the poles are where the
ice is. If I could use the Mississippi ice core I would, but unfortunately no such thing exists.
So, the temp
data in Greenland is -33C, whereas it would be warmer in the rest of the world.
The important thing is the ups and downs of the temp and how they don't
correlate to CO2.
Another
criticism that I would make (didn't see anyone else making it) is that the CO2
data was fairly low resolution, especially in comparison to the Greenland
ice core temp data.
Another
criticism may be that the CO2 data comes from EPICA in Antarctica while the
temps are from the other side of the world in Greenland. Still, though there
should be globally noticed signals and a correlation between temp and CO2 if
the IPCC CO2 warming claim was true.
I tried to
make the data show that there is no correlation between CO2 and temp over the
Holocene (last 10,000 years). In a sense you could say I "cherry
picked" the data I wanted, in order to show what I wanted it to, although
not in an underhanded way, but in a way that hopefully leads to the truth.
I welcome
the negative criticism as well as the positive. It would be embarrassing if I was wrong, but I
would much rather be wrong if it meant coming closer to the truth. So far
though, I don't see any reason to back down on the content of the video.
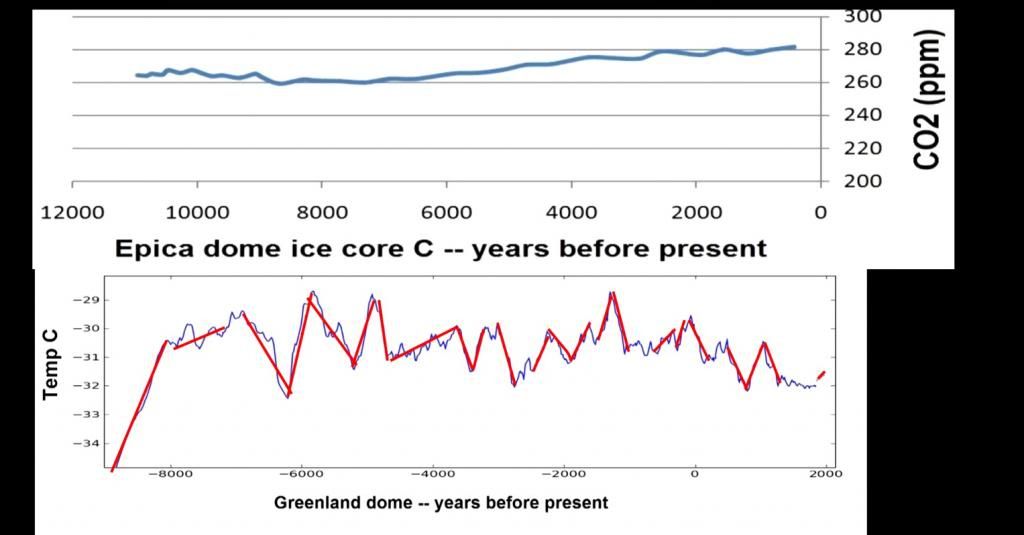
A further criticism is that I stapled a thermometer record over an ice core record, a la Mike's Nature trick where he put the thermometer record over the proxy record to hide the divergence. But I don't see that as problematic in this case, especially as there isn't a divergence between ice core and thermometer.
It's true that thermometers are different to ice core proxies of temp, which would use something like a ratio in oxygen isotopes to measure temperature. The main thing in tacking the instrumental record onto the ice core proxy record was to get the proportions right. Today's slight warming of 0.6C or so was not as big as past temperature changes according to the proxy.
Temp data from here:
http://www.foresight.org/nanodot/?p=3553
It's from the Central Greenland ice core, which I failed to specify on the above graph I used in the video (another criticism that was made).
CO2 data here:
http://cdiac.ornl.gov/trends/co2/ice_core_co2.html
== >
http://www.ncdc.noaa.gov/paleo/icecore/antarctica/domec/domec_epica_data.html
== >
ftp://ftp.ncdc.noaa.gov/pub/data/paleo/icecore/antarctica/epica_domec/dc_co2_hol_fl02.txt
And there's
already been a rebuttal blog post from a Swedish blog -- a negative criticism -- which I was happy
a critic brought to my attention, highlighting the comedic nature (or not) of my video:
http://uppsalainitiativet.blogspot.se/2013/12/sa-dumt-att-det-blir-kul.html
http://uppsalainitiativet.blogspot.se/2013/12/sa-dumt-att-det-blir-kul.html
Rather poorly translated by Google translate. I think the title should say something like: So stupid it's funny.


This video is full of weapons-grade dumb. Taking the GLOBAL temperature record and pasting it onto the GREENLAND temperature record is blatantly inaccurate and misleading, regardless of whether you believe humans are responsible for the warming.
ReplyDeleteAdmittedly, using a single ice core is not ideal for representing global temperature. However, I think you can see in all the ups and downs that global conditions are strongly reflected in the Greenland core. E.g.:
ReplyDeletehttp://www.foresight.org/nanodot/wp-content/uploads/2009/12/vostok.png
The Central Greenland ice core is used because it's a convenient way to get a handle on global temps, but unfortunately such cores are only at the poles, not globally distributed. I also admit that researching the validity of whether a single Greenland ice core is representative of global temp, is a low priority for me. Perhaps you could do me a favour and give a reference showing why I'm wrong?