See also my Arctic Sea Ice Volume Page.

Arctic Sea Ice Extent
The Northern Hemisphere Sea Ice coverage
Ice concentration higher than 30% are classified as ice:
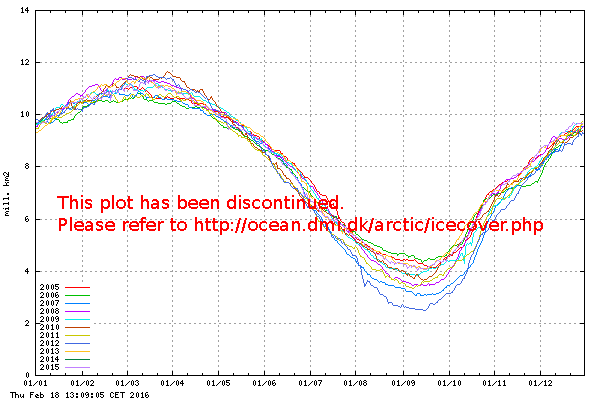
Sea ice extent in recent years (in million km2) for the northern hemisphere, as a
function of date.
Please notice, that the sea ice extent in this plot is calculated with the coastal zones masked out. To see the absolute extent, go to this page.
Source. From page: http://ocean.dmi.dk/arctic/old_icecover.uk.php
function of date.
Please notice, that the sea ice extent in this plot is calculated with the coastal zones masked out. To see the absolute extent, go to this page.
Source. From page: http://ocean.dmi.dk/arctic/old_icecover.uk.php
Danish Meteorological Institute (DMI) – Centre for Ocean and Ice – Click the pic to view at source
Arctic Sea Ice Extent 15% or Greater (NANSEN)

Nansen Environmental and Remote Sensing Center (NERSC) – Arctic Regional Ocean Observing System (ROOS) – Click the pic to view at source
Arctic Sea Ice Area

Nansen Environmental and Remote Sensing Center (NERSC) – Arctic Regional Ocean Observing System (ROOS)- Click the pic to view at source
Nansen data (CSV file with both extent and area) download here
Arctic Sea Ice Extent – 15% or greater:

National Snow & Ice Data Center (NSIDC) – click to view at source
Arctic Sea Ice Extent -15% or Greater:

Japan Aerospace Exploration Agency (JAXA) – International Arctic Research Center (IARC) – Click the pic to view at source
Arctic Sea Ice Extent – 15% or Greater:

Japan Aerospace Exploration Agency (JAXA) – International Arctic Research Center (IARC) – Click the pic to view at source

Charctic Interactive Sea Ice Graph
Antarctic Sea Ice Extent – 15% or Greater

Arctic satellite temp:

Antarctic Temperature:
RSS Southern Polar Temperature Lower Troposphere (TLT) – 1979 to Present
 - 1979 to Present")

National Snow & Ice Data Center (NSIDC) – Click the pic to view at source
Arctic satellite temp:

The above graph is not auto-updating. Last updated by me: Feb 2015.
RSS Southern Polar Temperature Lower Troposphere (TLT) – 1979 to Present
Remote Sensing Systems (RSS) – Microwave Sounding Units (MSU) – Click the pic to view at source
No comments:
Post a Comment